Bates College
Department of Digital & Computational Studies
Final Project – DCS 204 Data Cultures

introduction
As a culmination of the work we did in DCS 204, this project assembles different parts of the data we collected and analyzed throughout the module in an attempt to answer some underlying questions which arise when we delve deeper, with a more scholarly eye, into said data. Over the course of these few months, we have talked extensively about the financial history of Bates College and about how even though Bates prides itself on being founded by abolitionists, it still accepted money made on the back of enslaved people. I thought it was interesting, in this light, that the datasets we worked with referred to the contribution of a certain demographic of donors. Consequently, several voices are lost if we try to take into account who contributed to the college’s creation. In this project, I will attempt at demonstrating that the contribution of a certain demographics of people has been glorified while those of other demographics has not been credited, let alone cited. Hence, my question for this project is:
What is the most common demographic recorded and put forward in the data about the donors of Bates College?
Through the lenses of different concepts and theories we encountered in the scholarship suggested by this class, I will try to infer meaning from the findings my research will produce to further investigate about those whose contributions did not go down into the historical archives of the college.
literary review
My previous blog post laid the foundation for the scholarly material which will prove useful in the presentation of my final project. Throughout the module, we have been presented with several concepts and methodologies when it comes to the general perceptions and preconceptions about data, its nature, its manipulation, and its flaws. Several concepts we learned about focused on the considerations we must take when working with data, even before the inception of said work. All in all, we have encountered material which has helped us sharpen the way we look at data analysis. I aim at applying those good practices in the investigation concerning the demographics of the donors to Bates College.
What would the chosen question tell us about the microcosm of Bates College back in the 1850s and how is it related to the silenced voices related to the Bates community? In my project, I will attempt to answer these questions while also addressing those which come up as a corollary of this discussion. Therefore, the way I present and communicate my ideas are important and, for this reason, I will implement Yau’s suggestions about “Design with a Purpose”. This theoretical framework will ensure that the voices of historically oppressed groups are put forward and not further suppressed. I will now proceed to enumerate other class materials which will prove helpful in my project.
One of the first concepts we learned about in class was that of racial capitalism. In his presentation, Kelley traces the origins of racial capitalism back to feudalism, racialism and nationalism which existed in Europe well before the dawn of any kind of other social economic system. He goes on to describe racial capitalism as the process of deriving social and economic value from the racial identity of another person based on a White-favored hierarchization of race and ethnicity. Said hierarchization was used to justify the various social disparities among social groups and especially to uphold the marginalization and exploitation of non-Whites. This takes the form of social ostracization, slavery, and racism. In this light, how is racial capitalism reflected in the data we studied and, more specifically, in the demographics of Bates’ donors? This is a correlation which, I believed, deserves due consideration.
Another concept we talked about in class was that of design justice, from an article by Costanza-Chock. Most design processes today reproduce the inequalities and disparities we see in society. Design justice invites us to rethink said design processes, and to center people who are normally marginalized by design. The application of this principle consists in the examination of data in a fashion which aims at empowering underrepresented groups with the active acknowledgement that capitalism is inextricably tied to racial and gender dimensions. This is, to me, the most relevant tool in analyzing the data in my project, mostly because of the nature of its nature. The data about the donors and about the inception of Bates has been recorded by White and privileged people and they have chosen to only keep their fellow White and privileged contributors in the history of Bates College. Design justice becomes crucial in dismantling this ideology since we want to restitute their weight and impact to the communities which have been silenced for centuries, in this case, the Lewiston-Auburn community.
data description &
@naly$!$
The data I am using in this project is the product of the communal work we have been transcribing as a class. The first significant piece of data is called “MSS_all_donors” and it comprises a data frame of donors to Bates College with transactions which were recorded during the 1850s and the 1860s. The information given in this data frame is the name, location, and amount of money donated to the college on what particular date. It is helpful to note that some of the data we are using in this data frame is a population sample from the population of all donors to Bates. Hence, our findings might not describe the reality of what it aimed at describing to the full extent of its capacity. It is helpful to keep that in mind as we progress through this research.
As part of the last code writing worksheets for the class, we considered a data frame (“MSS_donor_bio”) with donors and the standardized professions of donors and the value of their household. This information was obtained from the Maine State Census and will prove useful in the analysis I am about to execute.
The demographics I am most interested in refer to the household value and profession of the donors. What strata of the population in Maine in 1850s could easily afford to donate to a college? What were their professions and how comfortably did they live? And, most important, why is this the demographic that Bates chooses to put forward in the history of the actors in its inception?
In my first analysis, I chose to look closely at the value of household of the donors. I removed all rows which had missing values in the “Census_Household_Value” column and I also removed those with zeros because, otherwise, it would have lowered my estimations and my mean. Recall that a reported household value of zero does not mean that the actual value of the household was zero. It could have been unknown by the census responder or the collector could have omitted to mark it as a missing value. The code below provides us the information we need about the household values.
#Loading the dataframe with info about household value
donors_with_housevalue <-read.csv("MSS_donors_bio.csv")
head(donors_with_prof)

#I want to see only the columns numbered as such
columns_of_interest <- c(1,3,5,7,8)
subset_donors <- donors_with_housevalue[ , columns_of_interest]
subset_donors #New data frame with columns of interest

########## Analysis of Household Value
#Making sure that unreported data doesn't lower our mean
#dropping rows with NA
subset_donors_na <- is.na(subset_donors$Census_Household_Value)
subset_donors[which(subset_donors$Census_Household_Value != subset_donors_na), ]
#dropping all the 0s
df2<-subset(subset_donors, Census_Household_Value!="0") #dropping NAs and 0

hist(df2$Census_Household_Value) #ploting a histogram
plot(df2$Census_Household_Value) #producing a scatterplot
mean(df2$Census_Household_Value) #mean of household value
max(df2$Census_Household_Value)  #maximum household value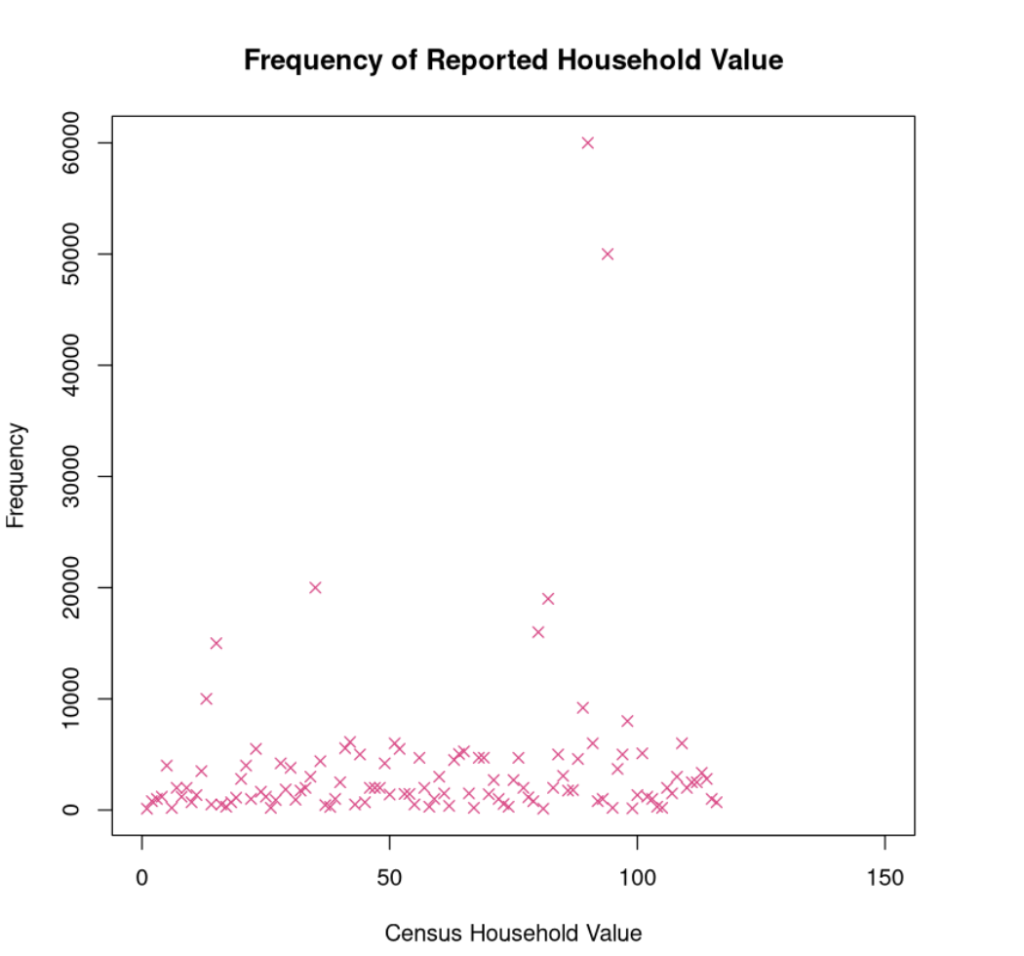
The scatter plot above shows us the distribution of household value among our sample population. The analysis reveals that the mean of the household values among the donors is about $5300. The maximum amount of the household value is $60,000 Therefore it can be argued that the upper quartile of the typical donor would live in a household whose value would lie between these two prices. This is the first major point of this study.
Next, I went on to analyze the professions of the donors. For this, I merged the two initial data sets and I created a restricted data frame which showed more information about the donors. I chose to standardize the professions by use of a controlled vocabulary in order to allow for more ease in the analysis process. Below is the code and a table showing the controlled vocabulary I used.
donors <- read.csv("MSS_all_donors.csv") #Loading the first dataframe
head(donors)

donors_with_prof <-read.csv("MSS_donors_bio.csv") #Loading the dataframe with info about professions
head(donors_with_prof)

restricted_dataset <- merge(donors_with_prof, donors,
by.x = c("Name_CV", "First", "Middle", "Last", "Location"),
by.y = c("Name_CV", "First", "Middle", "Last", "Location"),
all.x = FALSE,
all.y = FALSE)

#Load data for controlled vocabulary
professions_cv <- read.csv("professions_CV.csv")
professions_cv
#Then merge with existing restricted data frame

donor_bios <- merge(restricted_dataset, professions_cv,
by.x = "Census_Profession",
by.y = "Census_Profession",
all.x = TRUE,
all.y = FALSE)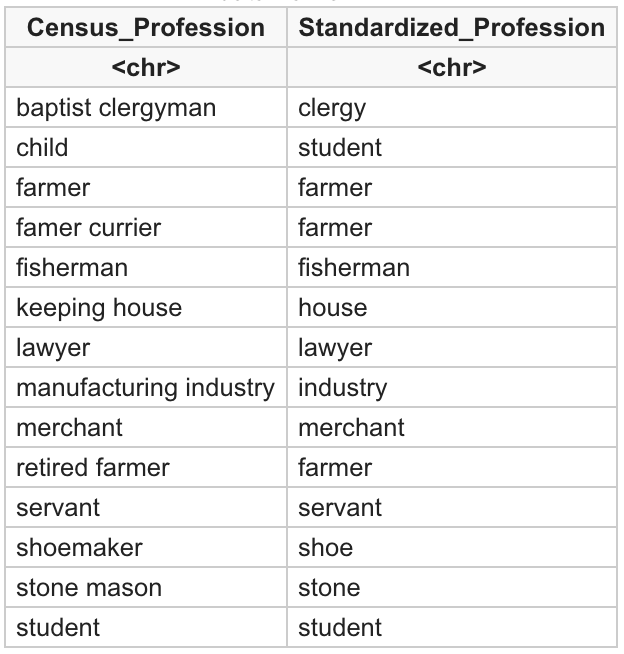
The analysis reveals that the donors in this data frame are students, farmers, fishermen, merchants, and lawyers.
Let’s talk demographics
It is safe to infer that the people who constitute our data set were part of the middle to upper societal spheres of 1850s Maine. On average, they would live in household which were quite valuable for that period of time and they had occupations which not only allowed them to live comfortably but which also allowed them to afford donating to the college. The occupations of the donors resemble those of the middle to upper middle class of today. The value of their household also amounts to prices which support this argument. By using the online CPI inflation calculator, we see through inflation, that $5300 in 1850s amounts to $178,714.64 today and that $60,000 roughly amounts to $2 million today. These people were quite wealthy for the most part.
This is the demographics that is represented through the historical archives of the college by the Maine State Seminary. The contributors – those who went down in history as the heroic donors who allowed the college to be – were generally middle to upper class professionals who practiced law or farming and who lived rather comfortably. It is also safe to assume that they were predominantly White.
What about the enslaved people?
But were these White professionals the sole contributors to the creation of Bates? The answer is a plain ‘no’. In Synthesis#2, I analyzed the invoices from the Bates Mill data. It comprises the data we transcribed during the first week of class about donations by Benjamin Bates which came from money he made through the cotton picking industry. In that synthesis, I demonstrated that the total weight of the cotton in all the bales he sold was 625656 pounds and that the total amount of time stolen from enslaved people to produce the cotton featured on these invoices was 4171.04 days.
Now this is a number is completely hidden and obliterated when we look at the historical archives of the college concerning the donors. Why is that so? The answer is an ugly truth. Bates benefited from donations from rich white men who earned money on the back of the people they enslaved. When Kelley talks about racial capitalism, this is what he means: the silencing and continued atemporal exploitation of people of African descent who were held hostage and exploited for the profit of White men and women. The fact that Bates choose how to tell the story of its past is highly questionable. It does not align with the vision of design justice we should stand for. In this particular case, we need design to ensure that quantitative data does not become a flawed representation of the past, and that it does not further silence the voices of the oppressed.
We saw that Bates recorded the contributions of middle class White men and women in their archives and deliberately discarded the contribution of enslaved people in its history. For Bates to call itself ‘abolitionist’ and to extrapolate this part of their story is not only an act of deception but mostly one which perpetuates the matrix of domination, as Kelley would put it. Because of the way we define racial capitalism, we can say that Bates is engaged in the process of deriving social and economic value of specific demographics of people based on a White-favored hierarchization of race and ethnicity. White voices are glorified. Others are silenced, erased.
I would say that data and data analysis should be instrumental in helping to dismantle the ravages of racialization and white supremacy, not to endorse nor perpetuate them. After this analysis, it should be evident that the authentification of existing records is crucial in the discourse and work towards the restoration of the identity of historically marginalized and oppressed groups.
